
Stablecoin supply barely moved in 2026 as usage jumped 41%, and tokenized RWAs grew 51% to $38.6B. Asia carries half of corridor volume, mostly in dollars.
Stablecoin activity grew far faster than supply in 2026. Market cap rose just 1.0% from the end of December to $306B at the end of September, moving within a $298B–$316B range through the year. Adjusted monthly transfer volume, by contrast, increased 41.4% from $230B in January to $325B in September, lifting monthly volume relative to market cap from 0.77x to 1.06x. Transaction volume reached $2.33T over January to September, up 48.6% year over year. Infrastructure was the largest category at $751B, reflecting liquidity moving between chains, exchanges and applications. Monthly payment volume rose from $33.2B to $54.1B, though payments remain a minority use. Supply stayed concentrated: dollar tokens accounted for 99.5% of market cap, with USDT and USDC together holding 84.6%. Over the same period, tokenized RWA value grew 51.3% to $38.6B, lifting the RWA-to-stablecoin ratio from 8.4% to 12.6%.
APAC’s local-currency stablecoin market remains small and is still in the early stages of issuance. Globally, non-dollar stablecoins totalled about $1.49B at the end of September 2026, up from $919M at the start of the year and above the January 2022 peak of roughly $1.20B. Euro ($904M), yen ($233M) and Brazilian real ($221M) tokens accounted for just over 91% of that total. Within it, Asia-Pacific tokens grew from $48.5M to $261M, lifting their share from about 5% to 18%, though they remain a negligible part of overall stablecoin supply.
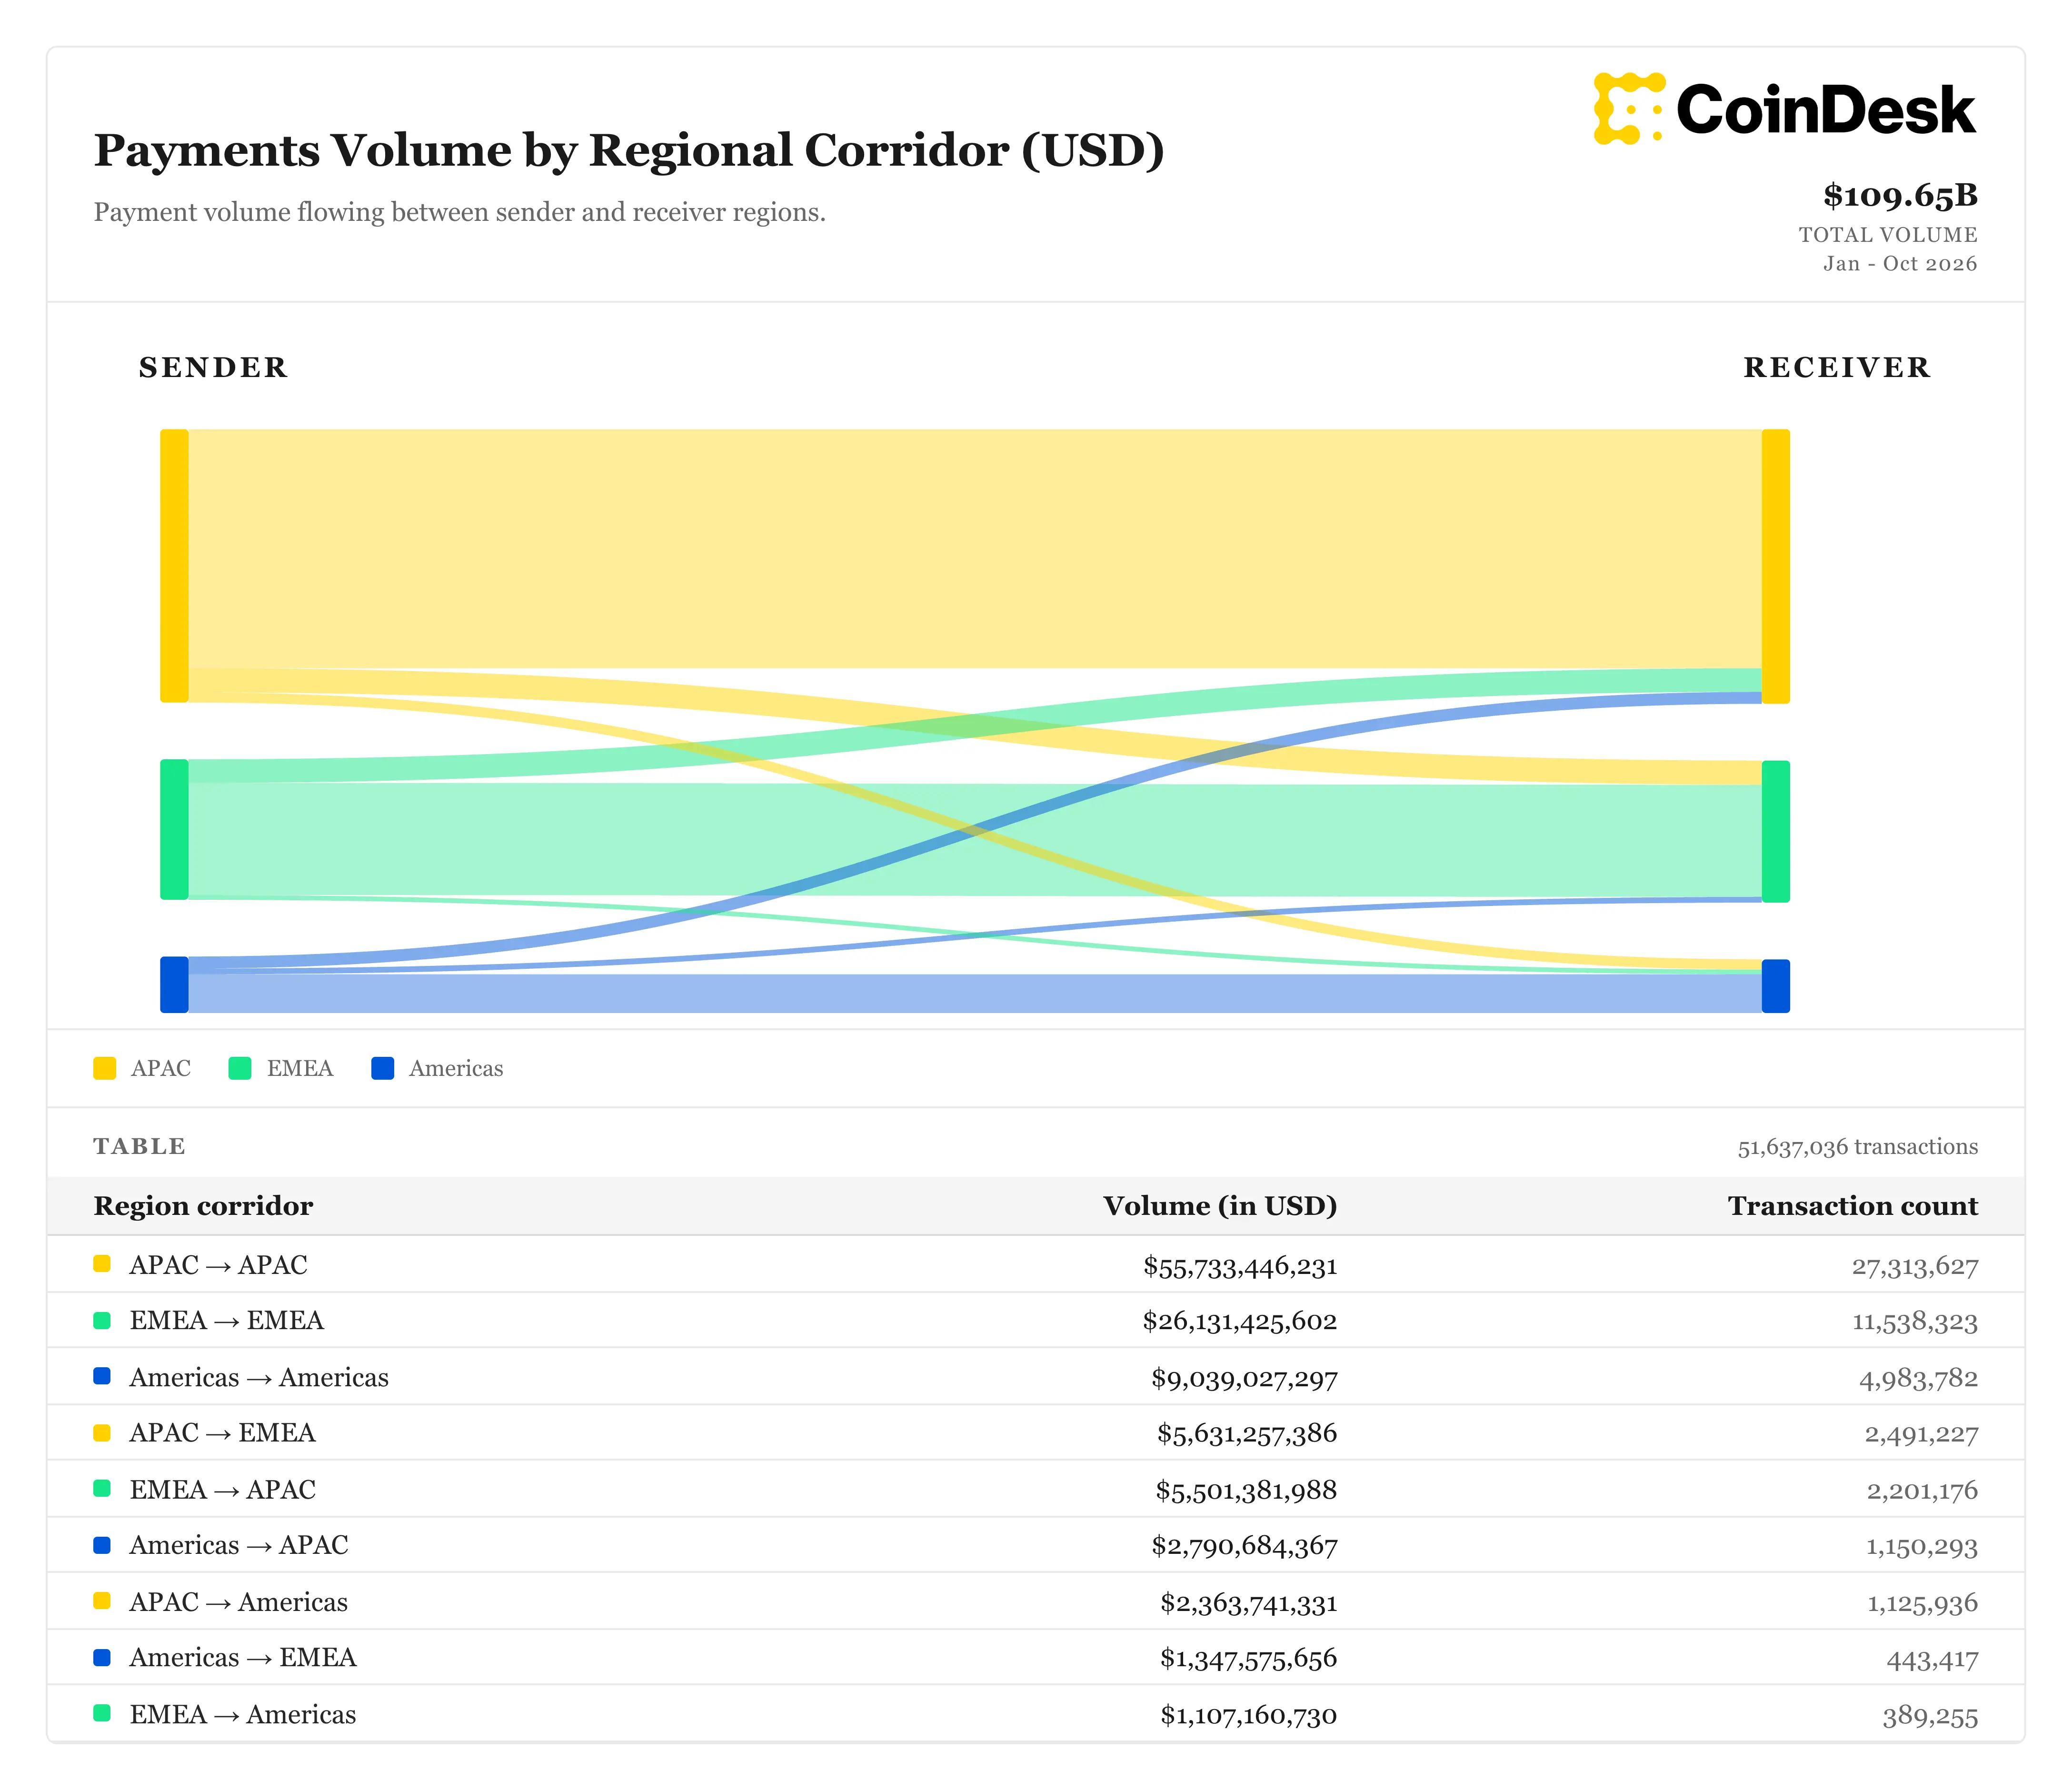
Stablecoin payment volume reached $109.65B across 51.6M transactions between January and October 2026. Intra-Asia-Pacific transfers accounted for $55.7B across 27.3M transactions, or 50.8% of corridor volume and 52.9% of transactions. That is more than double intra-EMEA flows ($26.1B) and six times those within the Americas ($9.0B).
Cross-regional activity remained comparatively limited: Asia-Pacific to EMEA totalled $5.6B, EMEA to Asia-Pacific $5.5B and Americas to Asia-Pacific $2.8B. Average transaction sizes were broadly consistent across corridors, at roughly $1,810 to $3,040, indicating that Asia’s lead reflects transaction frequency and regional liquidity rather than larger individual payments.
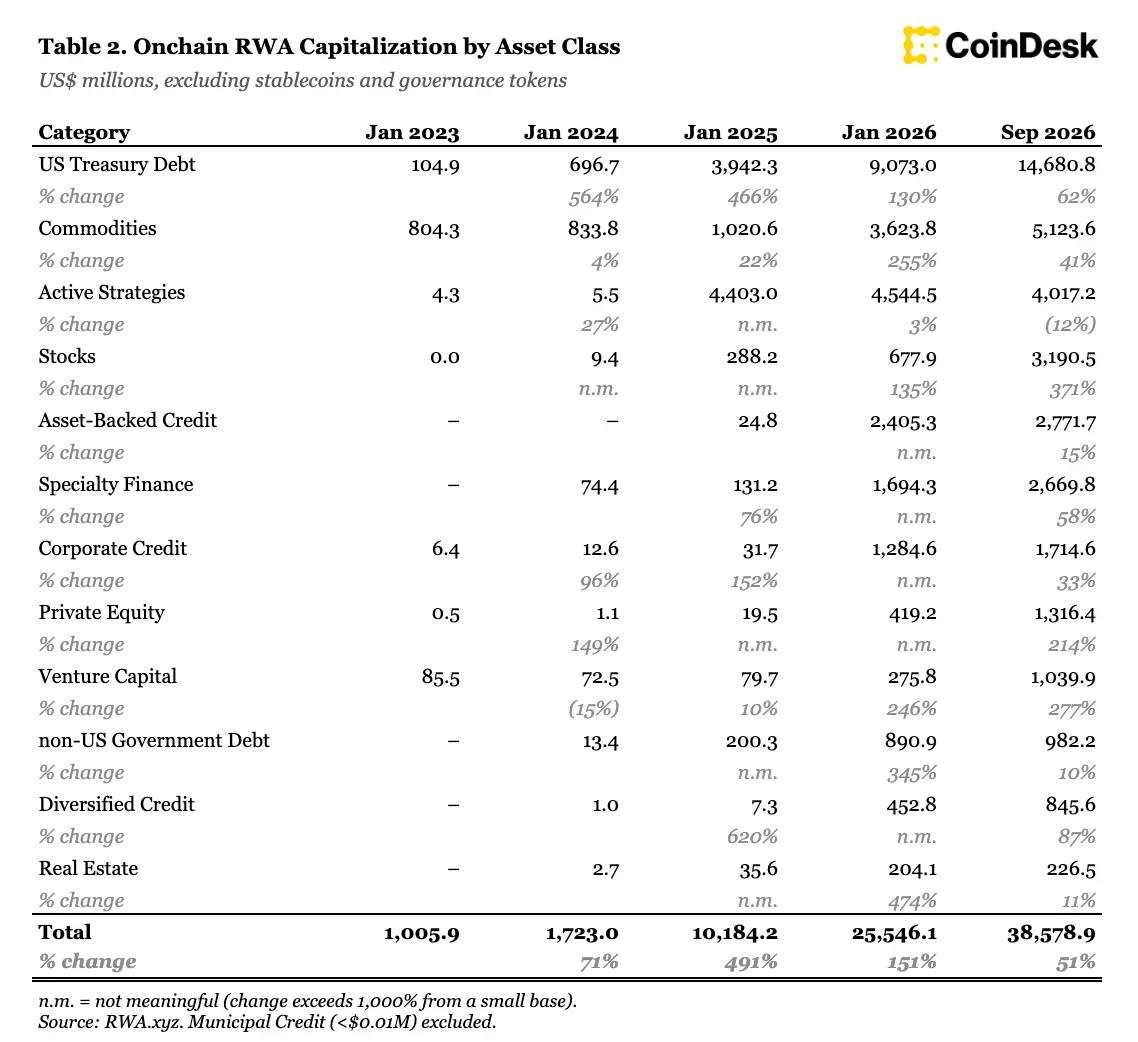
Tokenized RWAs have grown from a narrow market into a broad range of asset classes. Total onchain RWA value rose from $1.0B in January 2023 to $38.6B in September 2026. U.S. Treasury debt led that expansion, growing from $0.1B to $14.7B, up 62% this year alone. Commodities followed at $5.1B, up 41% year to date.
The fastest gains in 2026 came from smaller categories: stocks rose 371% to $3.2B, venture capital 277% to $1.0B and private equity 214% to $1.3B. Credit has also become a meaningful segment, with asset-backed credit ($2.8B), specialty finance ($2.7B), corporate credit ($1.7B) and diversified credit ($0.8B) together accounting for about $8.0B. Active strategies were the only major category to decline this year, falling 12% to $4.0B after leading the market in 2024.
Download the full report to understand why stablecoin usage is outpacing supply, how Asia’s regional payment flows are shaping its stablecoin market, and how the region is building a role in tokenized asset distribution and settlement.